
One common disagreement between those on the left and the right is about the success or failure of U.S. anti-poverty policy. It is common for progressives to laud social security, food stamps, and Medicaid as great policy victories. At the same time, conservatives will point to some of the same programs (though especially TANF) as a policy failure. Why the difference?
We need to start by identifying the goals of these social safety-net programs. Is participation a success? Lower poverty rates? Better public health metrics? It is not clear. Some folks on the left will count a program as a success based primarily on participation. If many people are taking advantage of a program, then it must be working. We can all admit that is a low bar. On the right, folks will sometimes use a diametrically opposite metric: participation is failure. The idea seems to be that these programs only work if people do not need them.
Let me propose a first-glance metric we can use to measure success: if social programs are working, they should, at a minimum, be reducing poverty. Put differently, the standard of living of those targeted by the program should be better off as a result of the program being in effect.
This too is a low bar, but it is an appropriate place to start because the goal of many safety-net programs is not to train people to build wealth, the goal is to keep folks from going hungry (food stamps) or allow them to go to the doctor (Medicaid). It is also not straightforward to measure. Ideally, we would be able to examine two different histories, one with all the safety-net programs we have, and one without. We could then compare the poverty rates between those two parallel worlds, and see the effect of government policy.
This is further complicated by the fact that our official poverty rate (OPM in the figure below) is a poor standard. The measure has remained fairly constant since the mid-1960’s with between 10 to 15% of the population in poverty. This poverty rate does not count any government benefits, even cash benefits like the EITC in people’s income, and does not do much to adjust for new expenses. It is a set multiple of the cost of food, adjusted for family size, set back in the 1960’s.
However, a study using a new supplemental poverty measure from the Census Bureau, a group of scholars at Columbia University found a way to make a much better comparison. The group created a measure of poverty that took into account a wider array of expenses and also counted income from a variety of market and government sources (Notably, they exclude Medicare, Medicaid, and childcare subsidies). They then “anchored” this measure so that we could compare absolute poverty across time (Anchored SPM in the figure below). This way, the poverty line, in terms of a standard of living, does not change across time, even if the population gets richer.
Their headline results are shown here:
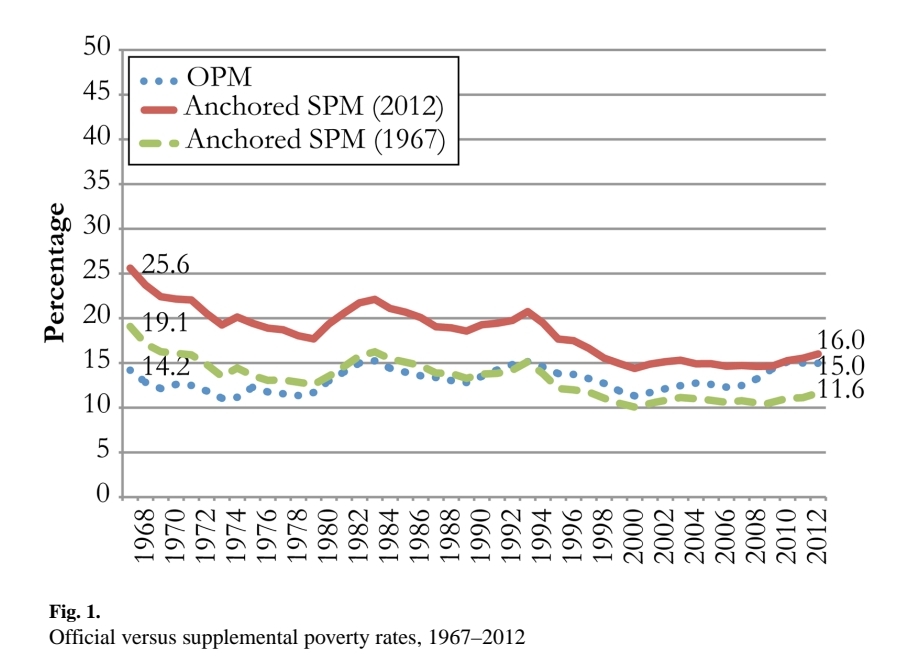
The group found:
Our estimates using an anchored SPM—which holds SPM thresholds constant over time— show that historical trends in poverty have been more favorable (and that government programs have played a larger role) than the estimates using the official poverty measure suggest. The OPM shows the overall poverty rates to be nearly the same in 1967 and 2012— at 14% and 15%, respectively. However, our counterfactual estimates using an anchored SPM show that without government tax and transfer programs, poverty would have been roughly flat at 27% to 29%; but with government programs, poverty has fallen from 26% to 16% —a 40% reduction.
Wimer et al. 2016. p. 6-7.
This is not the only study to find these kinds of results, but the simplicity of the design makes it a good example. This is clear evidence that absolute poverty has fallen over time. This, then, raises the question: what has caused that decline? Was it a change in market income or government benefits/taxation?
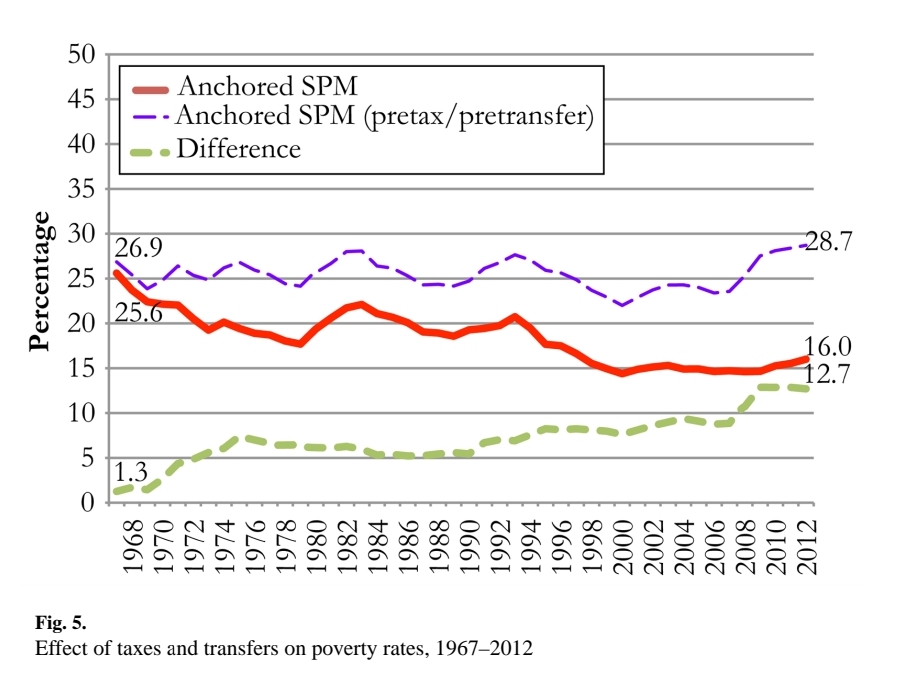
By looking at the sources of income over time (again, notably leaving out Medicare, Medicaid, and childcare subsidies) they find that:
Using the pretax/pretransfer measure, we find that poverty would have actually increased slightly over the period, from 27 % to nearly 29 %. After accounting for taxes and transfers, however, poverty would have fallen by approximately 40 %, from 26 % to 16 %. The figure also shows the growing role of taxes and transfers in reducing poverty, from only about 1 percentage point in 1967 to nearly 13 percentage points in 2012.
Wimer et al. 2016, p. 5.
They show the effect of government programs in this figure. where the purple dashed line shows the estimates of poverty rates before the government taxes income and provides benefits. The red line shows the net trend from above:
If you think that it is a failure for government programs to be needed to prevent poverty, then this is alarming news. But, at the same time, it gives us a first estimate of what poverty rates might look like today if those programs were abset.
The authors of this study note that this is an exercise in descriptive statistics only and that it does not take into account behavioral changes. For example, if you think that a bunch of folks would have been working if these programs had not existed and that they were not working because of the programs, then these results would overstate the effect of government programs. This is a big issue, and we do have evidence of just such a behavioral change. In aggregate, though, these authors conclude that the aggregate effect of such shifts on poverty rates will be small, citing this study. This is a question I will return to in more detail in other writing.